
Data Visualization for ML with Python
Your model deserves better visuals - not for aesthetics, but for convincing stakeholders


“Numbers tell a story - but only if you know how to make them speak.”
Most machine learning beginners focus entirely on models. How to train them. How to tune them. How to improve accuracy.
But the truth is: long before your model trains, you must understand your data. And understanding begins with seeing.
What is often missed in ML education is this:
If you cannot see your data, you cannot explain it. And if you cannot explain it, you cannot convince anyone - not your client, not your professor, not even yourself.
Whether you are a student preparing for a viva, a data scientist delivering insights to a CEO, or a researcher submitting to a journal - visuals are your most powerful tool of persuasion.
In this article + lecture, I walk through what I consider one of the most underrated pillars of machine learning practice - data visualization. Not the kind you sprinkle on slides. I am talking about meaningful plots that reveal the DNA of your dataset.
We explore Python’s three most powerful visualization libraries:
matplotlib- the foundational plotting engineseaborn- elegant and statistical plots, almost effortlessplotly- interactive graphics that do not just show, but respond
Our canvas for this journey is the Titanic dataset - famous, emotional, and structurally rich.
Why Visuals Matter in Machine Learning
Every ML project has three audiences:
You - the builder
The data - your raw material
The stakeholder - the person you need to convince
Each needs visuals - for different reasons.
You use plots to explore, diagnose, and refine. Your stakeholder needs to believe your model is trustworthy. And the data - it often hides its structure until you visualize it.
This lecture is about learning to see with precision.
Why data visualization is so crucial in ML?
What you need is evidence the ML model stakeholders can see.
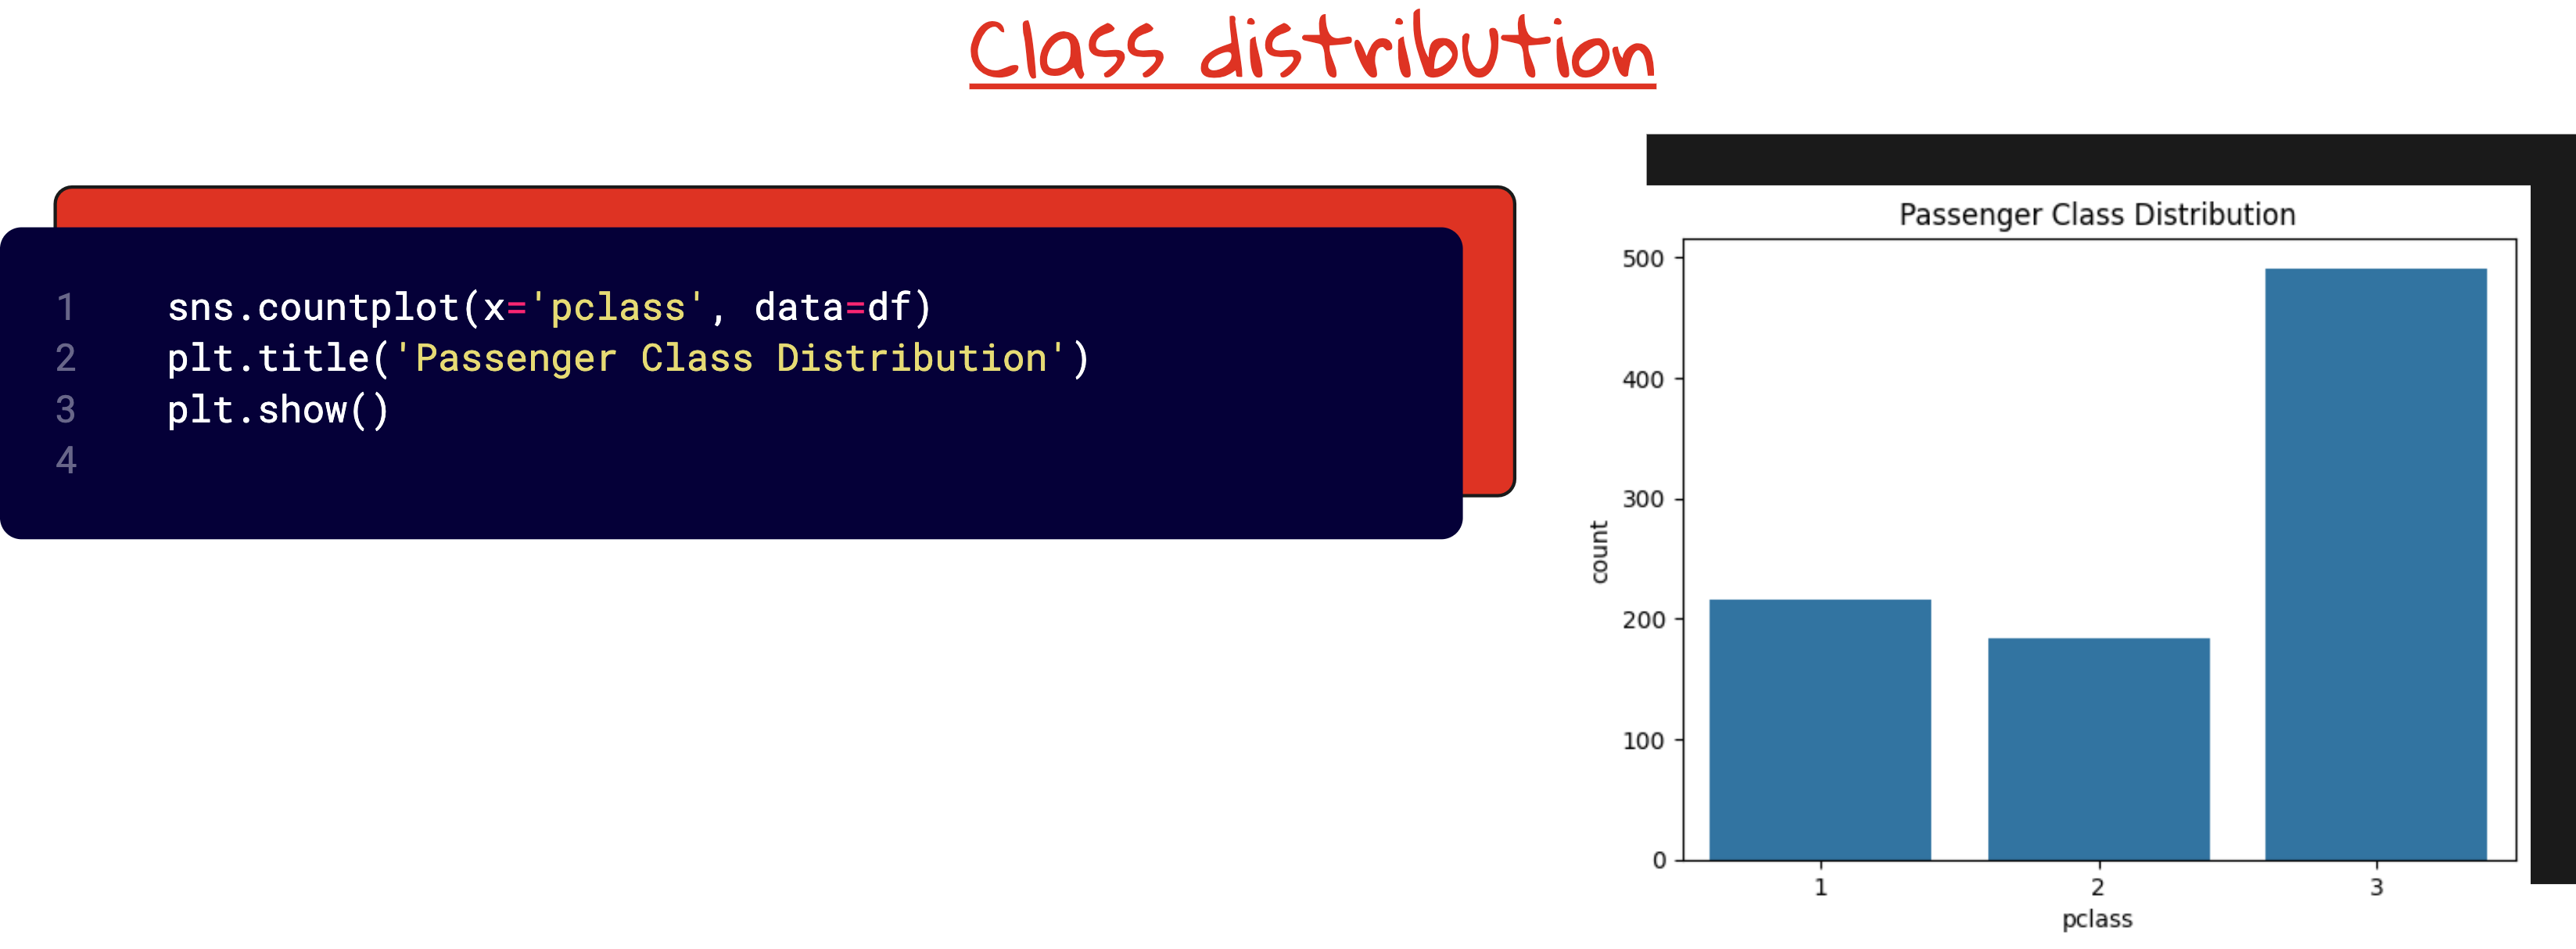
A bar plot showing class imbalance communicates faster than a paragraph.
A scatter plot with clear separation shows learnability.
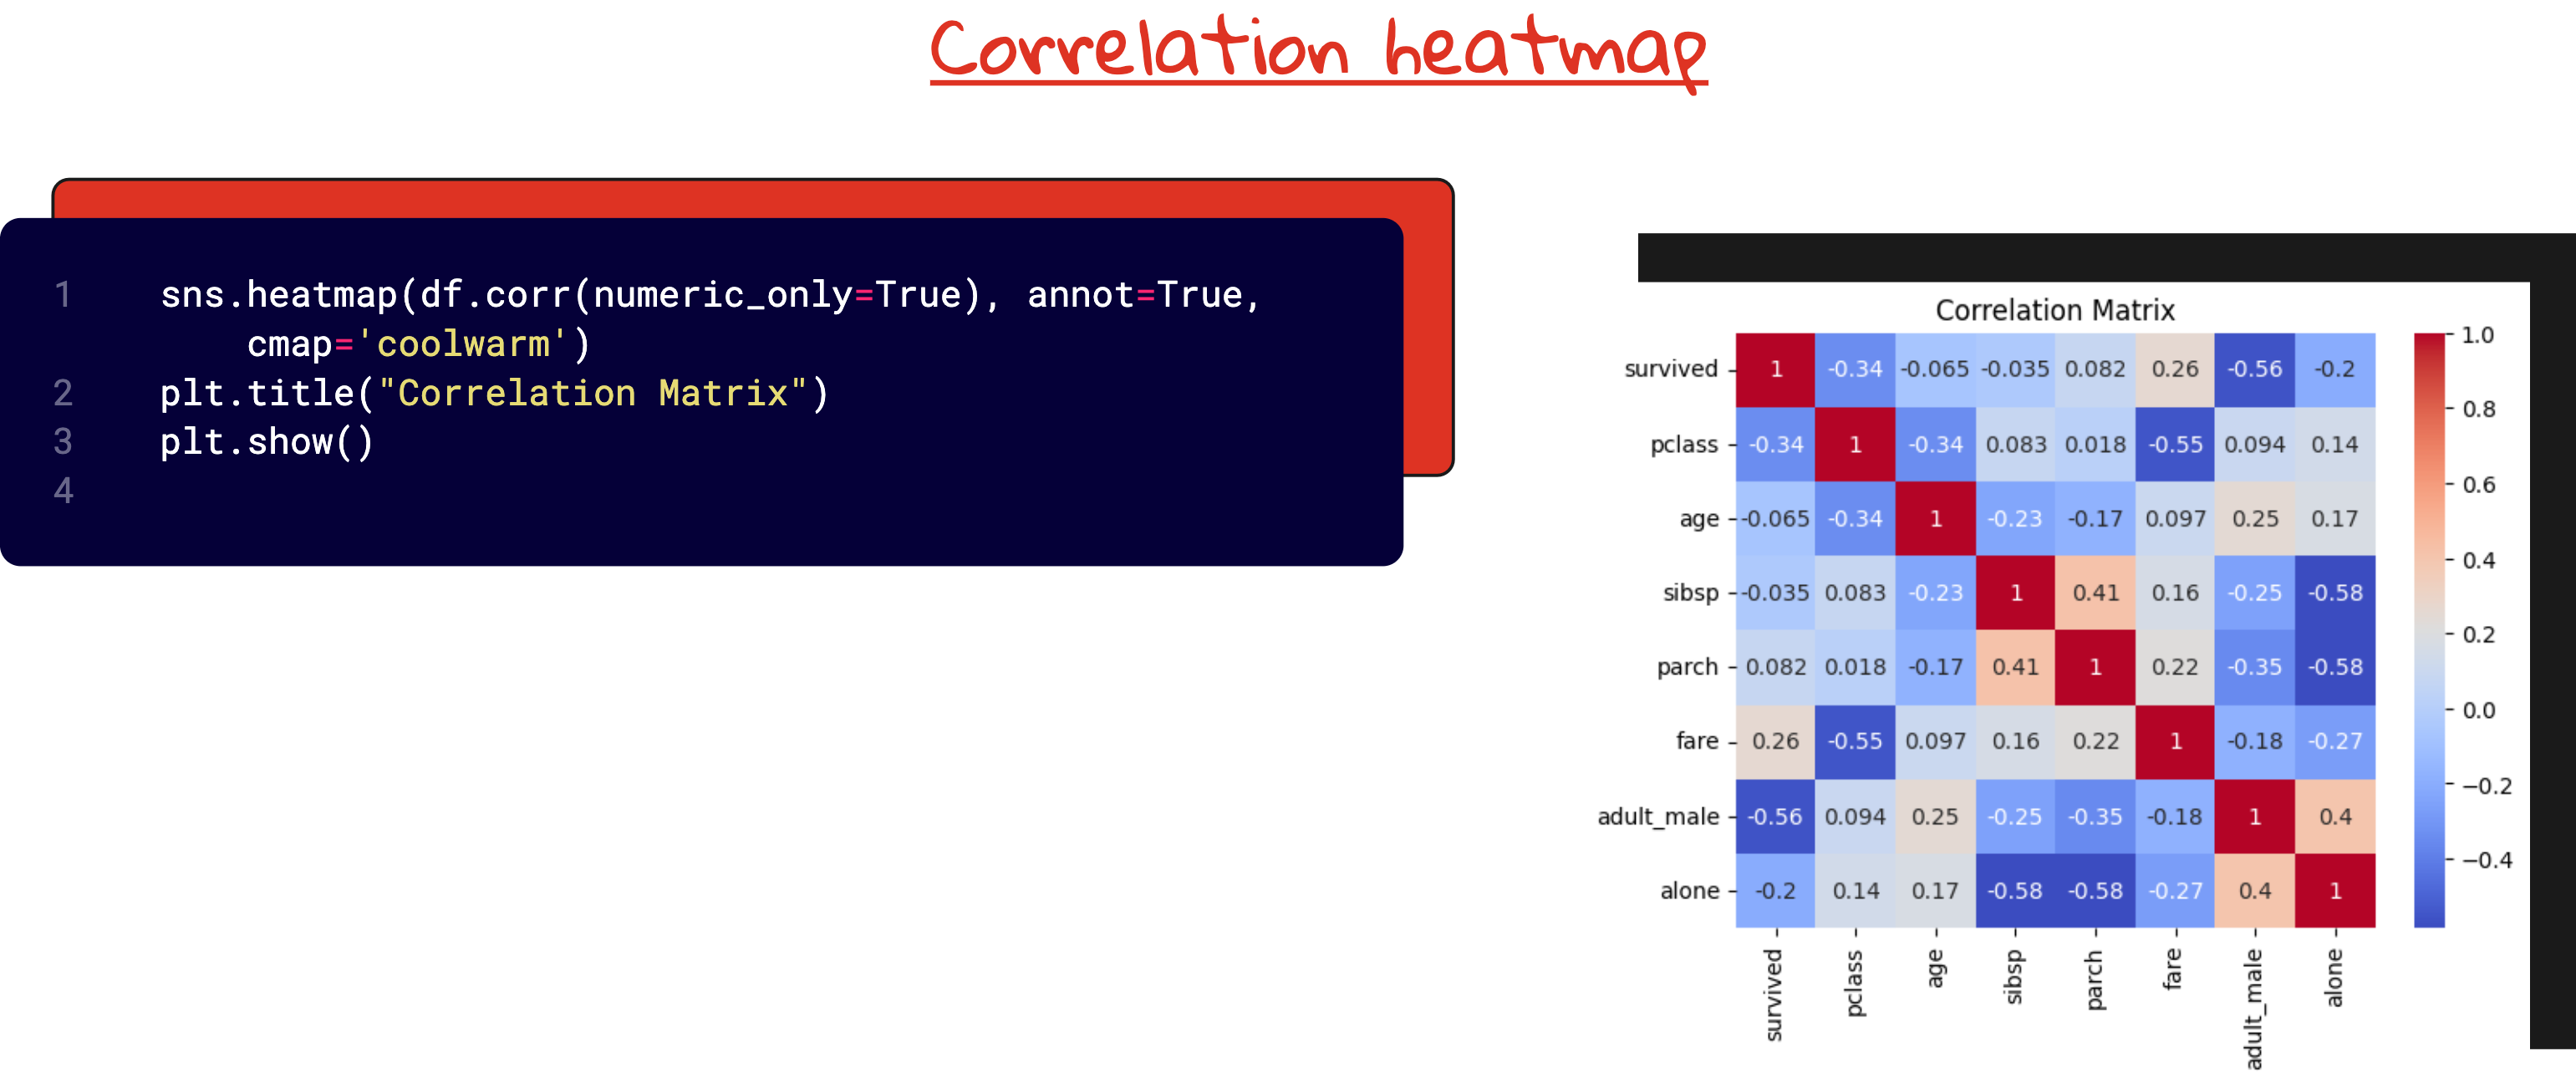
A correlation heatmap justifies your choice of features.
An interactive Plotly chart can hold a stakeholder’s attention longer than a dashboard.
Visuals are not optional - they are the bridge between what you did and why it matters. If your plot cannot explain your model, then your model is not ready for the real world.
This is not about making your Jupyter notebook look pretty.
This is about making your model understandable to the people who matter.

Matplotlib - The bedrock of Python visualization
Matplotlib is to plotting what NumPy is to computation. Not always elegant, but deeply powerful.
 - Brandfetch")
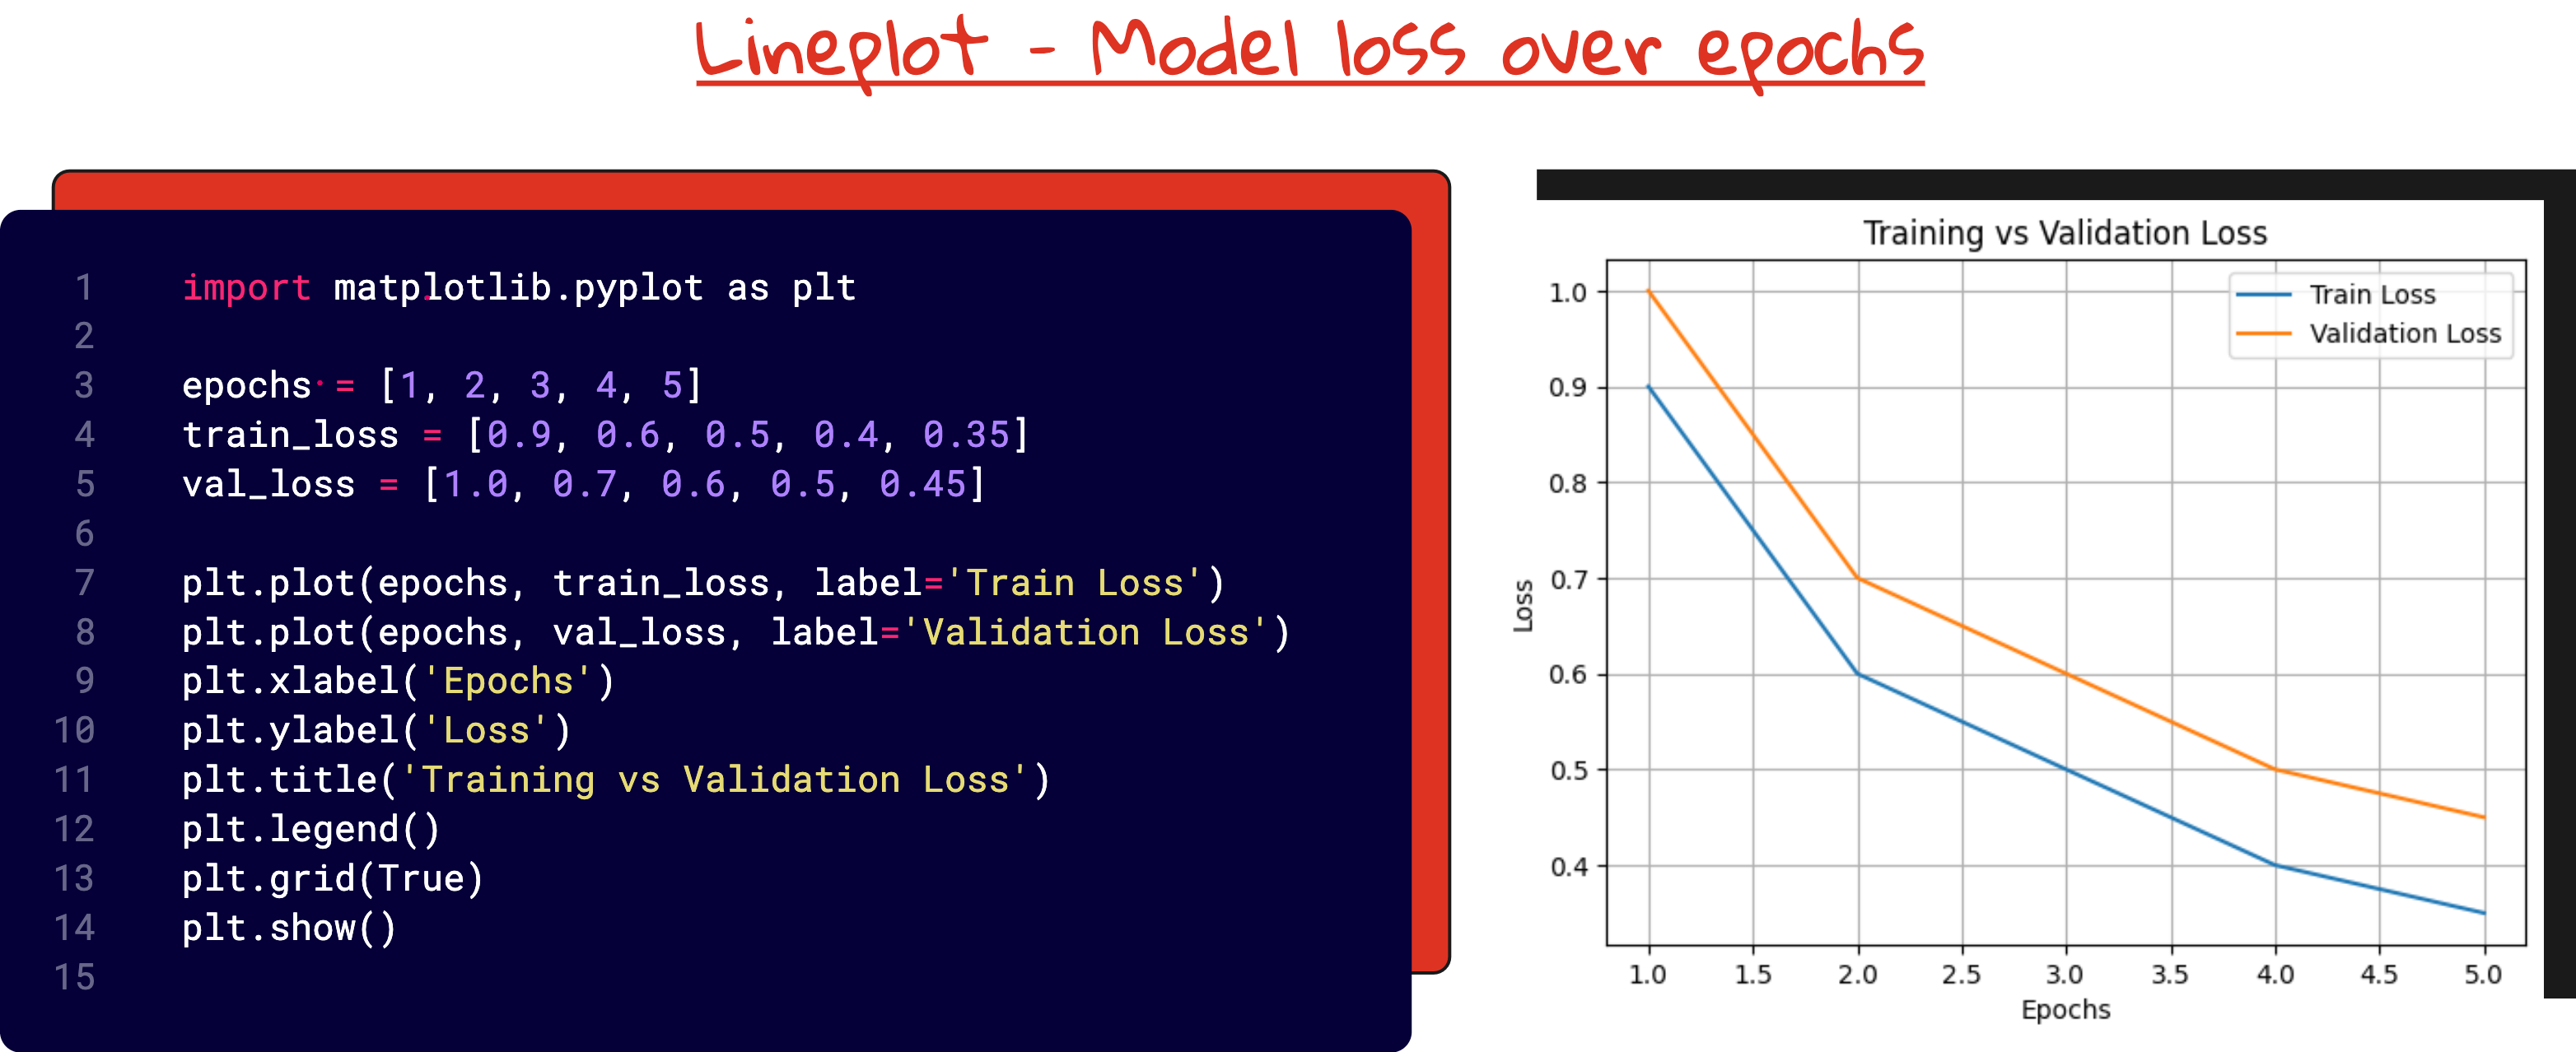
We start with a basic line plot - training loss vs validation loss over epochs. Then we add axes labels, legends, and grids. These are not embellishments. They are affordances that help you think.

Here are some of the common graph types you can create using matplotlib.

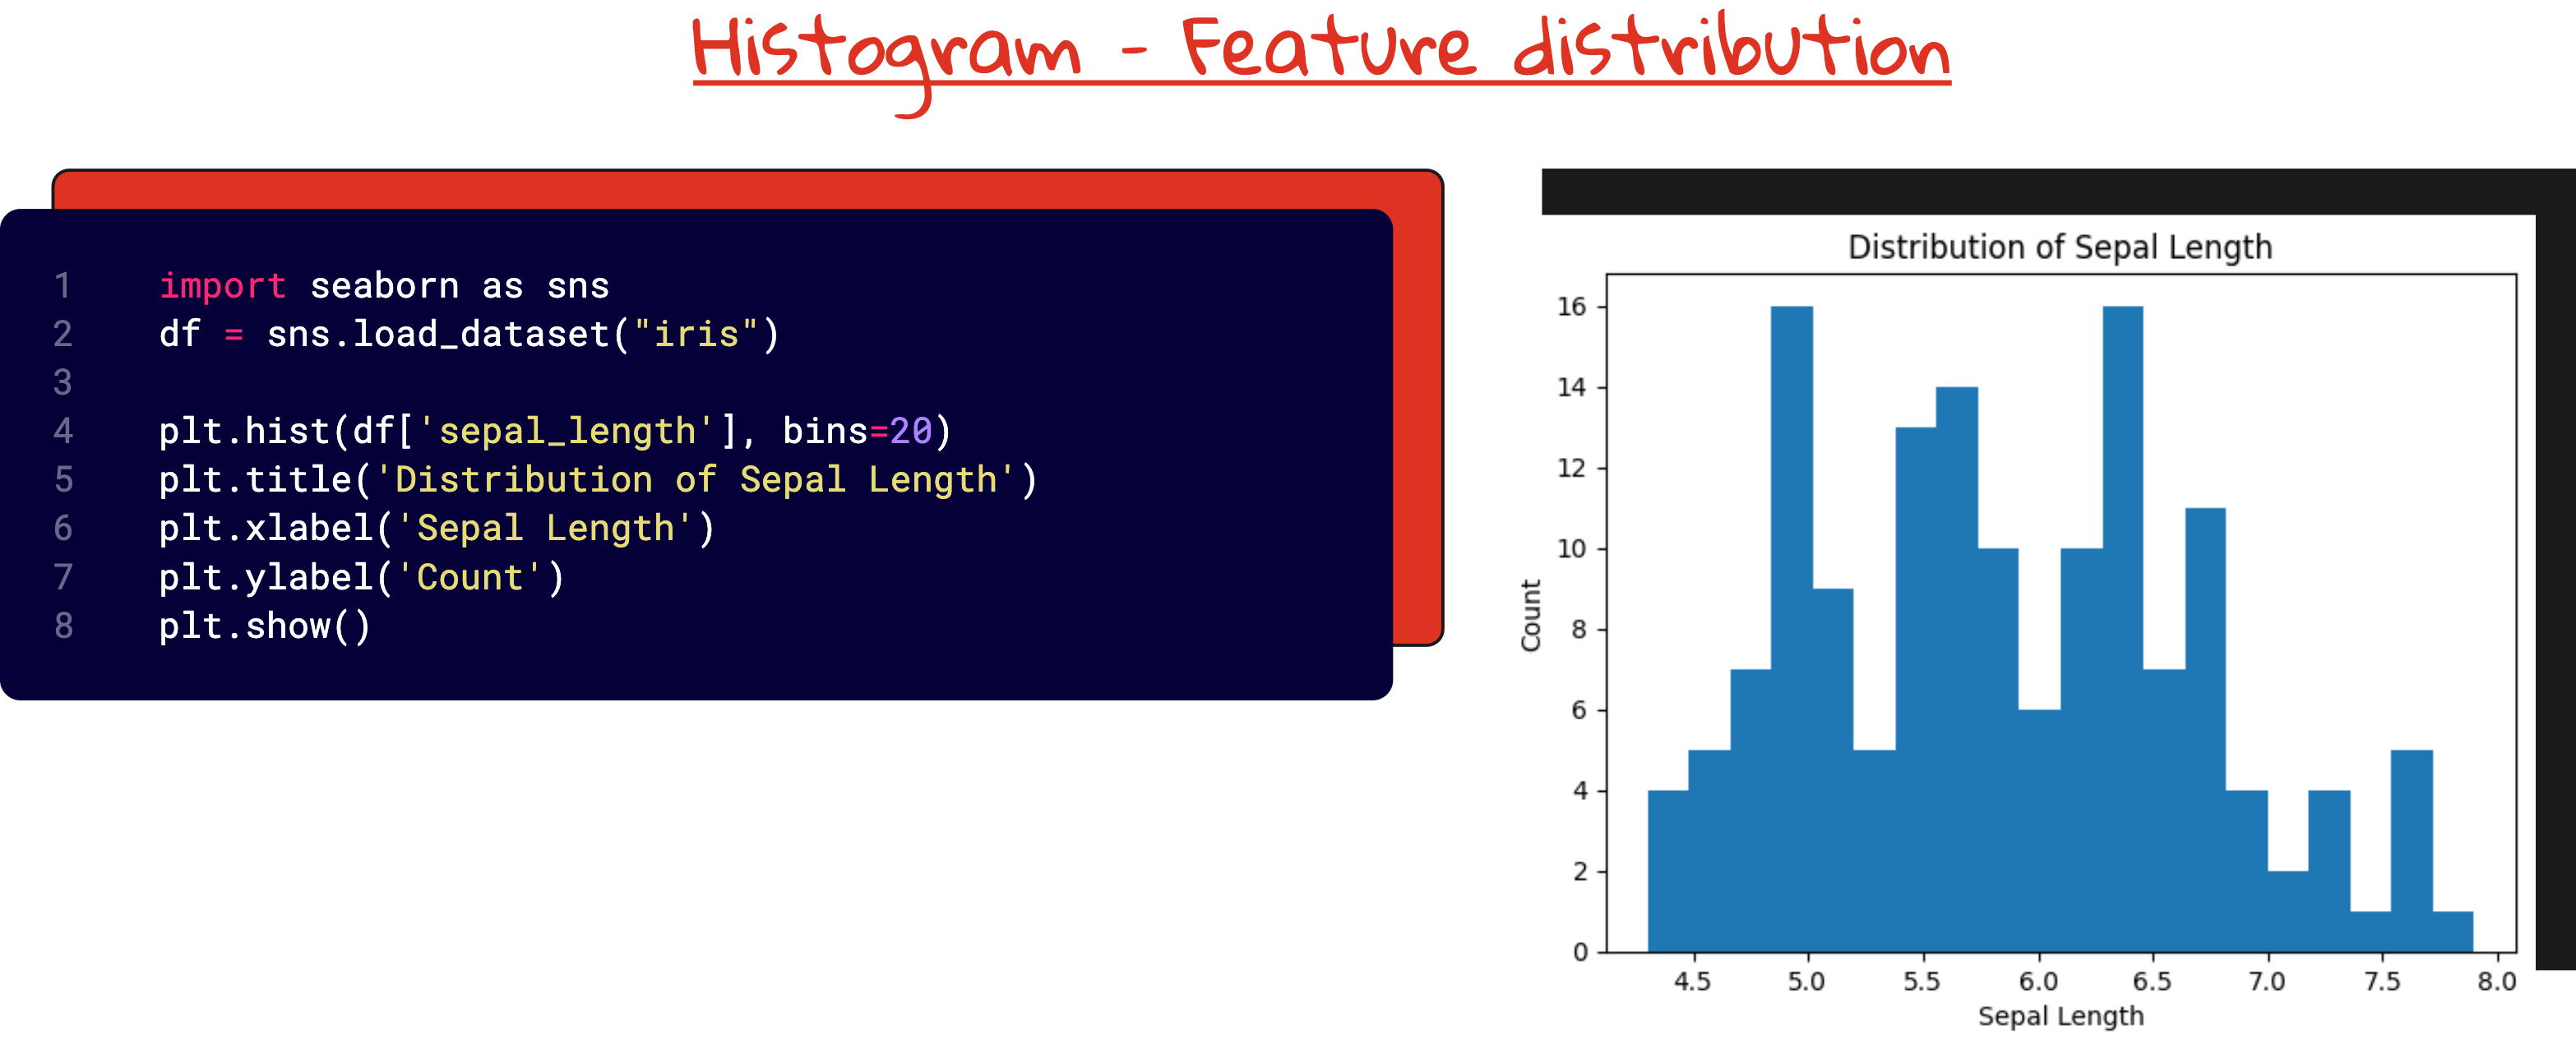

Each of these reveals a different slice of the dataset - structure, variation, and separability.
Seaborn - When statistics meets design
While matplotlib is about control, seaborn is about clarity. With fewer lines of code, you get high-quality statistical plots.
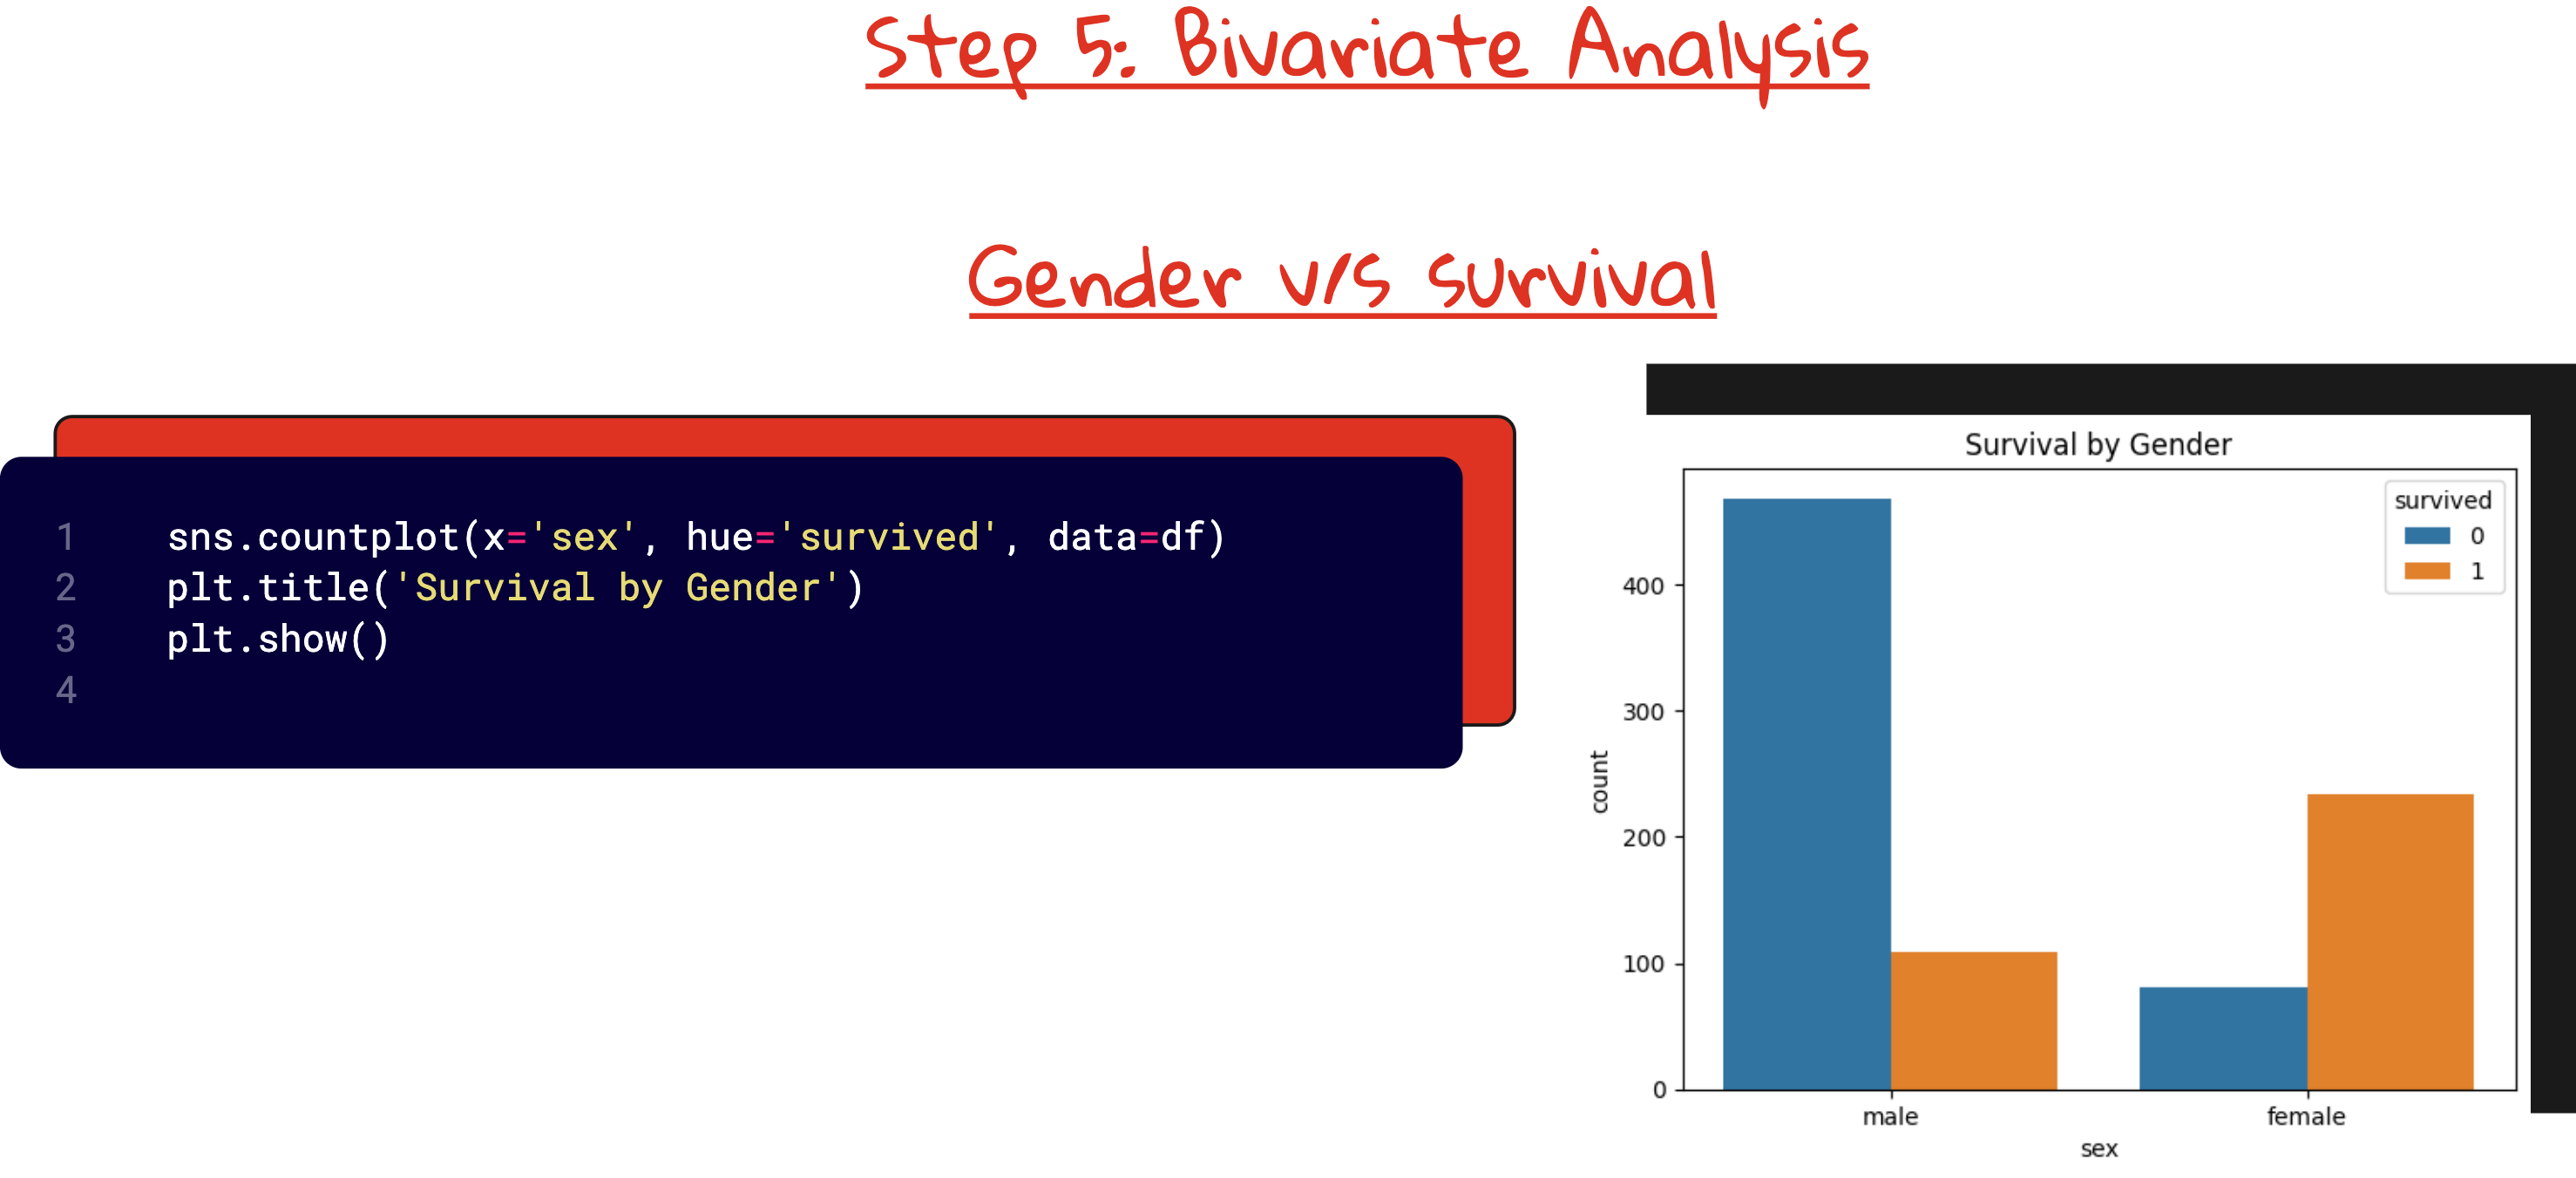
We dive into:
countplot- gender and survival rates on the Titanicboxplot- age distributions among survivors vs non-survivorsviolinplot- survival chances across travel classesheatmap- correlation matrices between features
About the Titanic Dataset
The Titanic dataset is one of the most iconic datasets in data science. It contains detailed information about the passengers aboard the RMS Titanic, which sank in 1912. Each row in the dataset represents a passenger, with attributes such as:
Survival (0 = No, 1 = Yes)
Pclass (Passenger class: 1st, 2nd, 3rd)
Sex
Age
SibSp (Number of siblings/spouses aboard)
Parch (Number of parents/children aboard)
Fare
Embarked (Port of embarkation: C = Cherbourg, Q = Queenstown, S = Southampton)
Its simplicity, combined with its historical context and binary outcome (survived or not), makes it a perfect dataset for beginners to practice data visualization, classification, and exploratory data analysis.


Here, we can test the following hypotheses using visualizations:
Does fare paid correlate with survival?
Do children have a higher chance of survival?
Does being in third class reduce your odds?
These are not questions answered by tables. They are answered by carefully constructed visual summaries.
Plotly - Interactive plots
Plotly brings your data to life. It makes your plots interactive.
We build:
Interactive 2D scatter plots - colored by species or survival
3D scatter plots - rotate and reveal hidden structure
Histograms and box plots - dynamic, hoverable, and insightful
What makes plotly powerful is not just its beauty, but its utility. Hovering over a point shows its age, fare, class, survival status - instantly. These are visuals that tell stories.


Exploratory Data Analysis on Titanic
The lecture concludes with a complete EDA workflow:
Handling missing values (age, embarked town)
Dropping irrelevant features (deck)
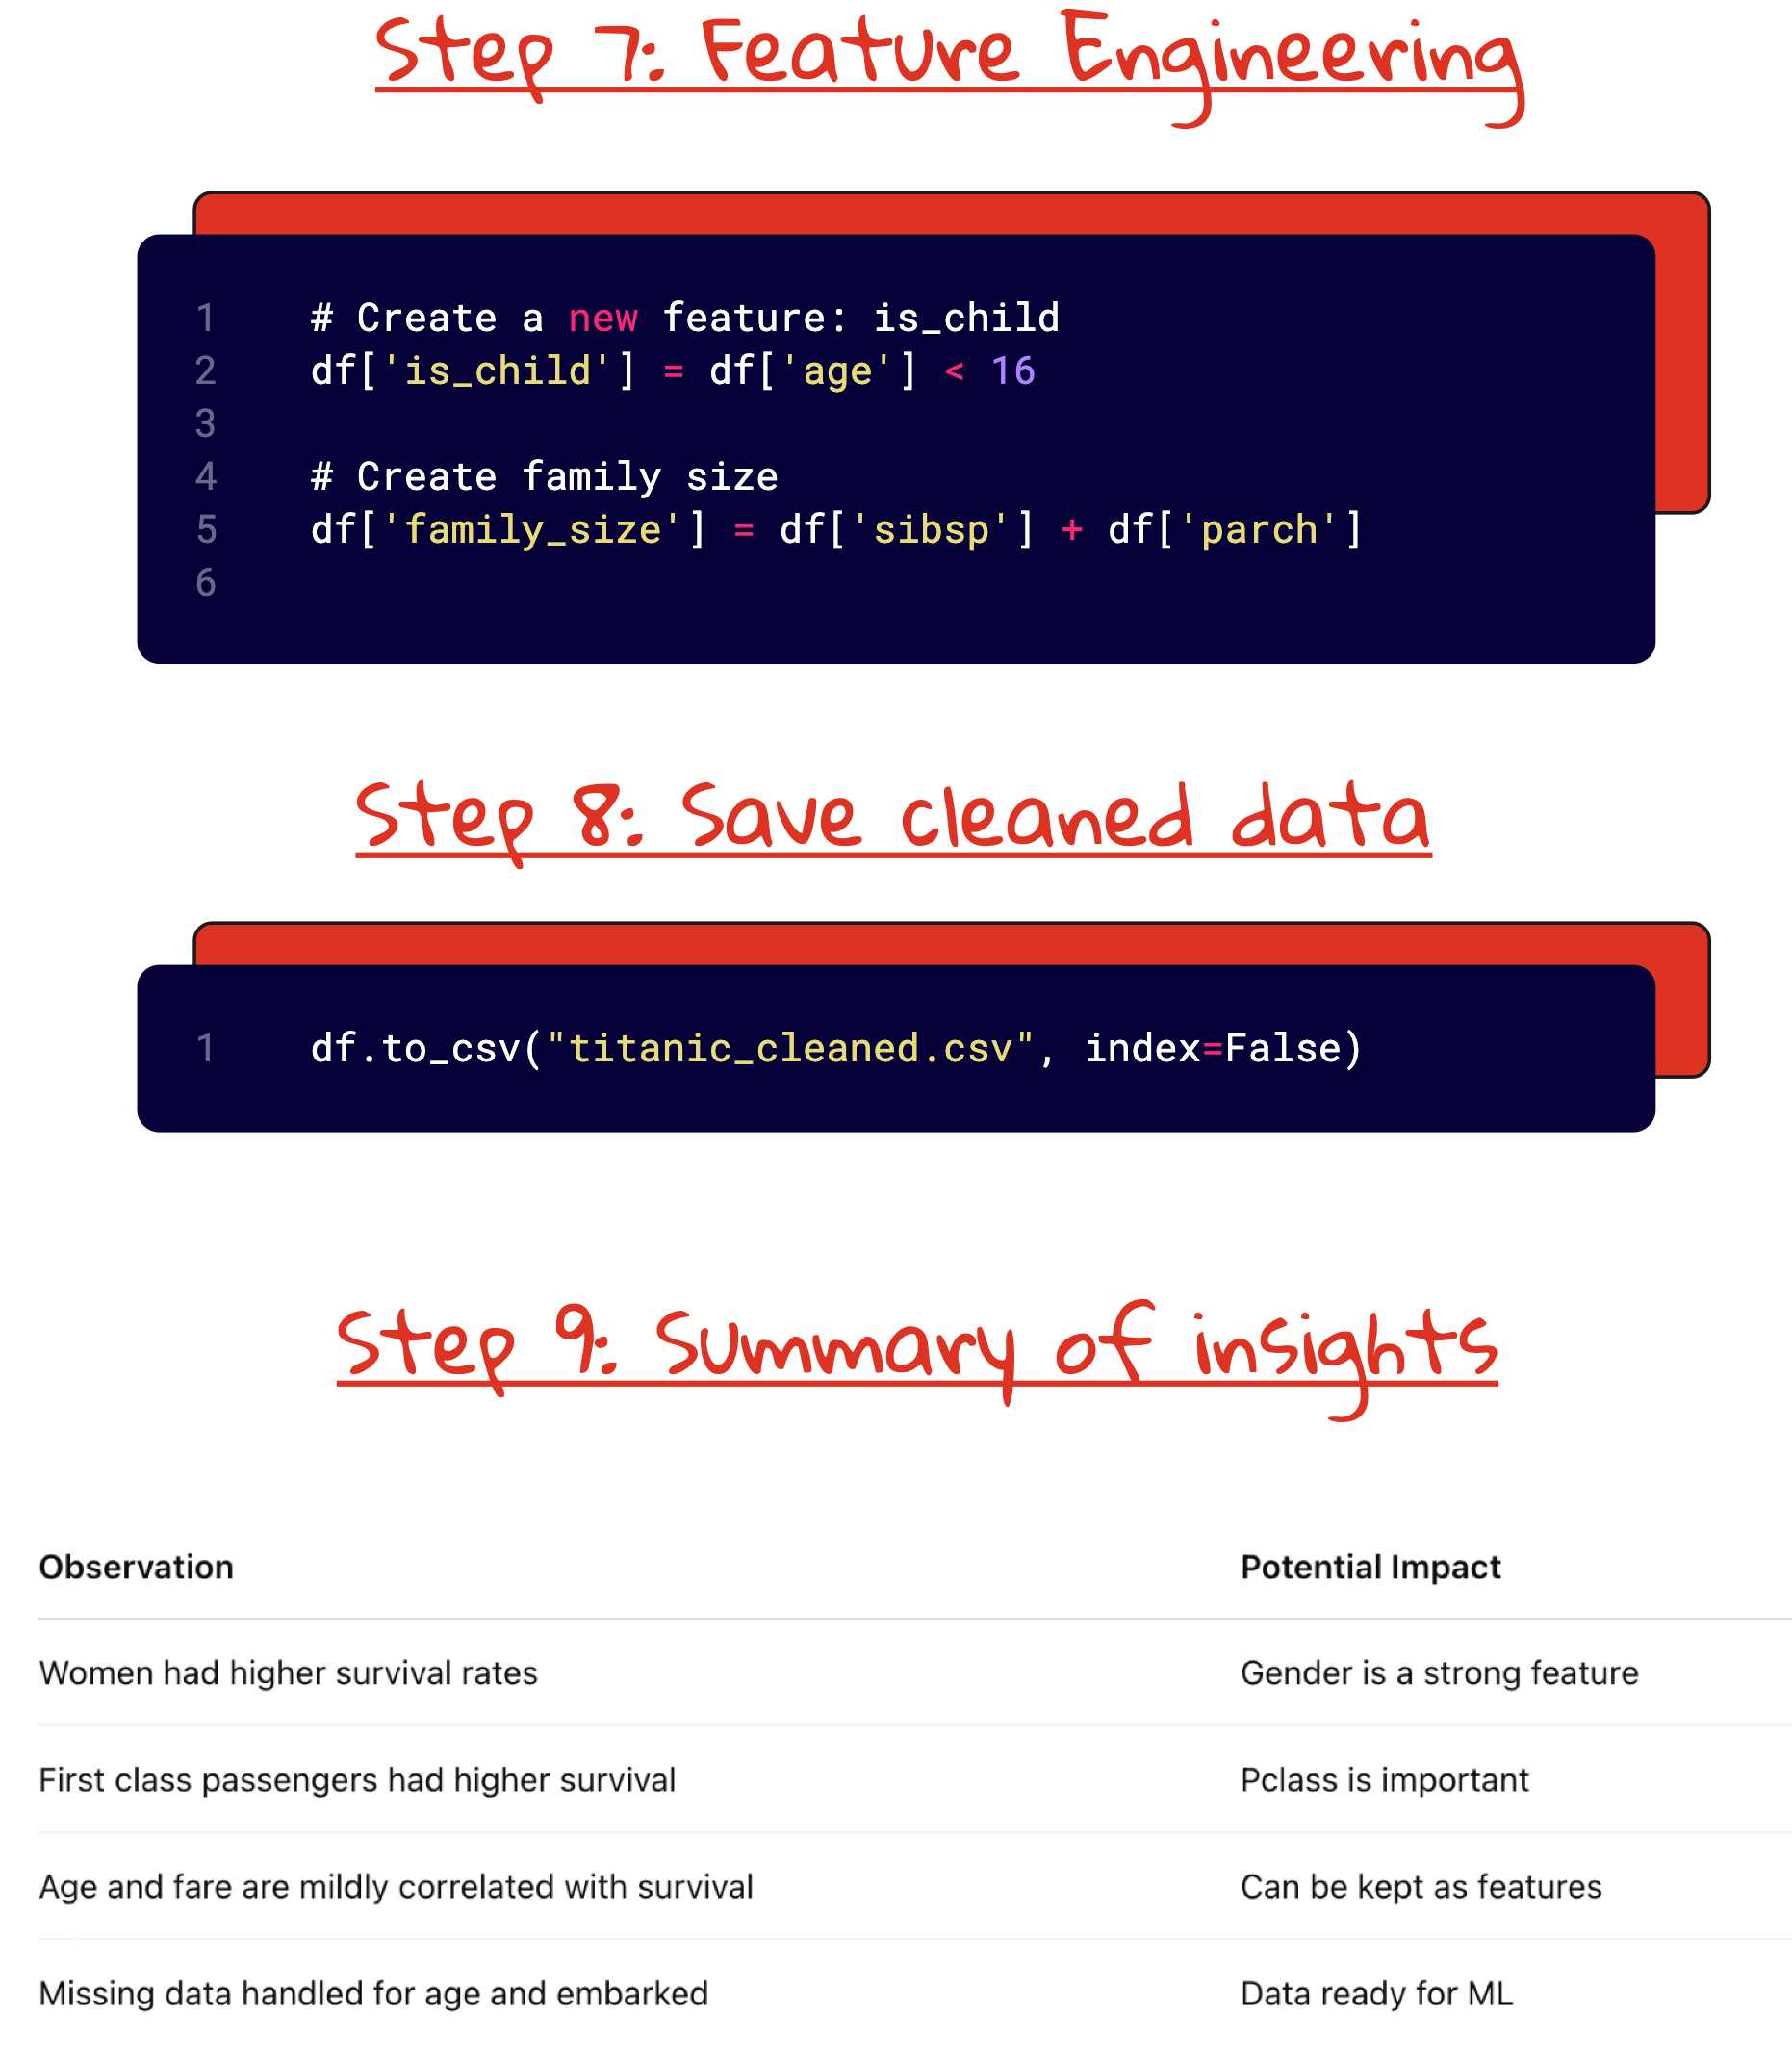
Creating new features (
is_child,family_size)Univariate and bivariate visualizations
Correlation heatmaps
Pair plots across features
This is not about getting the “right” plot. It is about getting the useful one.
The goal of EDA is not to impress, but to understand. To challenge your assumptions. To surface unexpected truths. And yes - to prepare your data for modeling in a meaningful way.


What You Should Take Away
Do not start with models. Start with plots.
The data will tell you what matters - if you let it speak.Visualization is not about decoration. It is about diagnosis.
Think like a doctor - look for anomalies, trends, and boundaries.Every good visualization changes your next step.
If it does not shift your thinking, it is not doing its job.You cannot convince anyone without a strong visual narrative.
If your client cannot understand your plot, they will not trust your result.
Final Thought
Your model is only as good as your data. Your understanding of your data is only as deep as your visuals. And your visuals are only useful when they are intentional.
Do not just train models - learn to see.
Full lecture video on YouTube
Here is the full code
Open Colab Notebook: https://colab.research.google.com/drive/1V0ghMGnRBpAHR9eAMx0HSM5jIToXp2LG?usp=sharing
Interested in learning ML foundations?
Check this out: https://vizuara.ai/self-paced-courses
Amazing, Dr. Sreedath! I really cannot thank you enough. I have been looking for something like this – a comprehensive tutorial on the different types of graph plotting in Python – in one single post for a long time. Really appreciate the effort you and the team put into making these.